Bar Chart Questions and Answers
Bar Chart Questions and Answers form Data Interpretation are updated here. A vast number of applicants are browsing on the Internet for the Simple Bar Diagram Questions Papers for Data Interpretation Question set. For those candidates, here we are providing the links for Multiple Bar Graph Examples with Questions.
Go through the below link to refer the Joint Bar Graph Examples with Questions Pattern. Improve your knowledge by referring the Bar Chart Questions and Answers papers. We provided Bar Chart Questions and Answers Papers are only for reference. Start to practice Percentage bar Diagram Questions Papers.
The Multiple Bar Graph Examples with Questions Papers are very helpful to score more marks in the exam.
Model Questions and Answers on Bar Chart
Directions (1-5): Read the following Bar Chart and answer the question given below it.
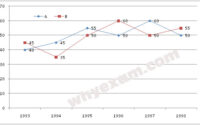
Production of paper (in lakh tones) by 3 different companies A, B and C over the years
 1. What is the difference between the production of company C in 1991 and the production of company A in 1996?
1) 50,000 tonnes
2) 5,00,00,000 tonnes
3) 50,00,000 tonnes
4) 5,00,000 tonnes
5) None of these
2. What is the percentage increase in production of company A from 1992 to 1993?
1) 37.5
2) 38.25
3) 35
4) 36
5) None of these
3. For which of the following years the percentage of rise/fall in production from the previous year the maximum for company B?
1) 1992
2) 1993
3) 1994
4) 1995
5) 1996
4. The total production of company C in 1993 and 1994 is what percentage of the total production of company A in 1991 and 1992?
1) 95
2) 90
3) 110
4) 115
5) None of these
5. What is the difference between the average production per year of the company with highest average production and that of the company with lowest average production in lakh tones?
1) 3.17
2) 4.33
3) 4.17
4) 3.33
5) None of these
Directions (6-10): Study the following graph carefully to answer the questions.
The production of fertilizer in lakh tons by different companies for three years 1996, 1997 and 1998

6. The total production by five companies in 1998 is what percent of the total production by companies B & D in 1996?
1) 100%
2) 150%
3) 95%
4) 200%
5) None of these
7. What is the ratio between average productions by Company B in three years to the average production by company C in three years?
1) 6:7
2) 8:7
3) 7:8
4) 7:6
5) None of these
8. For which of the following companies the rise or fall in production of fertiliser from 1996 to 1997 was the maximum?
1) A
2) B
3) C
4) D
5) E
9. What is the per cent drop in production by Company D from 1996 to 1998?
1) 30
2) 43
3) 50
4) 35
5) None of these
10. The average production for three years was maximum for which of the following companies?
1) B only
2) D only
3) E only
4) B & D both
5) E & D both
Directions (11 – 15): Study the following graph carefully and answers the questions given below it.
Productions of three types of tyres by a company over the year (in lakh)

11. What was the percentage drop in the number of C type tyres manufactured from 1993 to 1994?
1) 25
2) 10
3) 15
4) 25
5) None of these
12. What was the difference between the number of B type tyres manufactured in 1994 and 1995?
1) 1,00,000
2) 20,00,000
3) 15,00,000
4) None of these
5) 10000000
13. The total number of all three tyres manufactured was the least in which of the following years?
1) 1995
2) 1996
3) 1992
4) 1994
5) 1993
14. In which of the following years was the percentage production of B type to C type tyres the maximum?
1) 1994
2) 1996
3) 1992
4) 1993
5) 1994
15. The total production of C type tyres in 1992 and 1993 together was what percentage of production of B type tyres in 1994?
1) 50
2) 100
3) 150
4) 200
5) None of these
Directions (16 – 20): Study the following graph carefully and answers the questions given below it.
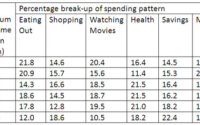
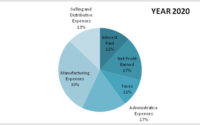
Accounts of income and expenditure (in crore) of seven companies in the year 2000.
Percentage\quad of\quad Profit/Loss=\frac { Income\quad -\quad Expenditure }{ Expenditure } \times 100
16. Approximately what is the percentage of profit/loss that companies C and D had together?
1) 10% profit
2) 12% profit
3) 10% loss
4) 12% loss
5) There was no loss or profit
17. If the income of company A increased by 10% in year 2000 from year 1999 and profit earned in 1999 was 20%, what was its expenditure in 1999? (The value upto two decimal places in crores)
1) 36.36
2) 32.32
3) 30.30
4) Can’t be determined
5) None of these
18. If the expenditure of company G in 2000 was 20% more than its expenditure in the year 1999 and the company earned a profit of 10% in 1999, what was the company’s income in 1999 (in crore)?
1. 37.5
2. 41.25
3. 34.09
4. Can’t be determined
5. None of these
19. Which of the following companies had the highest percentage of profit/loss in 2000?
1) 3
2) C
3) F
4) A
5) None of these
20. What is the approximate percentage of profit earned by all the companies together in 2000?
1) 11
2) 11.5
3) 10.5
4) 12
5) 12.5
Directions (21 – 25): Study the following graph carefully and answers the questions given below it.
Productions of food grain by a state over the years (1000 tonns)

21. The average production of 1990 and 1991 was exactly equal to the average production of which of the following pairs of years?
1) 1991 and 1992
2) 1992 and 1994
3) 1993 and 1994
4) 1994 and 1995
5) None of these
22. What was the difference in the production of food grains between 1991 and 1994?
1) 10,000 tons
2) 15,000 tons
3) 500 tons
4) 5,000 tons
5) None of these
23. In which of the following years was the percentage increase in production from the previous year the maximum among the given years?
1) 1991
2) 1993
3) 1995
4) 1990
5) None of these
24. In how many of the given years was the production of food grain more than the average production of the given years?
1) 2
2) 3
3) 4
4) 1
5) None of these
25. What was the percentage drop in the production of food grain from 1991 to 1992?
1) 15
2) 20
3) 25
4) 30
5) None of these
Directions (26 – 30): Study the following graph carefully and answers the questions given below it.
Number of Indian tourist and foreign tourist travel in the year 2010 in different districts of Himachal Pradesh.

26. How many districts in Himachal Pradesh were visited by more than 10% of the total Indian tourists?
1) 5
2) 3
3) 4
4) 2
5) None of these
27. By what percentage the Indian tourists visiting Chamba were less than those visiting Shimla?
1) 50
2) 55
3) 60
4) 70
5) 75
28. Approximately what percentage was shared by total foreign tourists among all the tourists visiting Himachal Pradesh?
1) 2
2) 8
3) 4
4) 5
5) 6
29. What was the ratio between the Indian tourists and the foreign tourists visiting Kullu?
1) 105:3
2) 70:3
3) 107:3
4) 35:1
5) None of these
30. Which of the following districts were visited by less than 10% of the total foreign tourists who visited Himachal Pradesh?
1) Chamba, Kullu
2) Solan, Kangra
3) Solan Chamba, Shimla
4) Solan,Chamba
5) None of these
Directions (31 – 35): Study the following graph carefully and answers the questions given below it.

31. By what approximate percentage the export of coffee increased from 1996-97 to 1997-98?.
1) 205
2) 185
3) 195
4) 200
5) 190
32. What is the ratio of the export of coffee in 1994-95 to that in 1996-97?
1) 69:85
2) 30:23
3) 85:69
4) 23:30
5) None of these
33. What was the percentage increase in the export of tea in 1997-98 from that in 1993-94?
A. 40
B. 90
C. 20
D. 35
E. None of these
34. By what percent from that in the previous duration?
1) 1
2) 2
3) 3
4) 4
5) None of these
35. What was the ratio between exports of coffee to tea in 1997-98?
1) 5:14
2) 2:5
3) 5:2
4) 14:5
5) 14:35